The Business Experiment Template
A structured framework for designing controlled experiments that test critical hypotheses with real users in real conditions — before committing significant resources. Surface silent assumptions, collect real-world evidence, and make informed go/no-go decisions.
Lifetime access · Free for students · Includes all 8 templates
What Is a Business Experiment?
A business experiment is a structured method for testing predefined hypotheses through data collected via a controlled, repeatable process involving a defined audience. As described in Innovation Mode 2.0, business experiments involve actual customers interacting with realistic prototypes in real market conditions. The objective is to produce evidence-based conclusions that inform decisions about whether to pursue, pivot, or park an opportunity.
Innovation Needs Novelty — and Novelty Brings Unknowns
Uncertainty and risk are, by definition, at the core of the innovation process. Even carefully evaluated opportunities carry known or unknown "unknowns" that can prove to be critical success factors. Projects and initiatives often embed what Innovation Mode 2.0 calls silent assumptions — beliefs and certainties that things will work in a particular way, adopted as obvious without being challenged or tested. These manifest as unchallenged statements about the effectiveness of a solution, the demand for a product, user behavior, pricing models, or adoption patterns.
When assumptions are left unaddressed, a decision to build a product without testing them can lead to failure that incurs financial, cultural, and opportunity costs. Business experiments flip this sequence: identify the riskiest assumptions, convert them into testable hypotheses, and gather real-world data that reduces uncertainty — before committing significant resources. This is the validation node of the innovation lifecycle: the bridge between a promising business idea and a development-ready product concept.
Created by George Krasadakis, the Business Experiment Template is a central element in the corporate innovation function and a thinking framework at the core of the experimentation mindset. It is one of the frameworks used in innovation advisory and AI strategy engagements with global companies. A successful business experiment provides clarity through real-world data and informs important decisions — regardless of whether the decision is positive or negative.
Six Elements of a Well-Designed Business Experiment
The template — as defined in Innovation Mode 2.0 — guides teams through six essential components that together form a robust, repeatable experiment design. Each element has a specific purpose: surface assumptions, define learning goals, choose the testing vehicle, recruit a valid audience, set guardrails, and pre-commit to decisions.
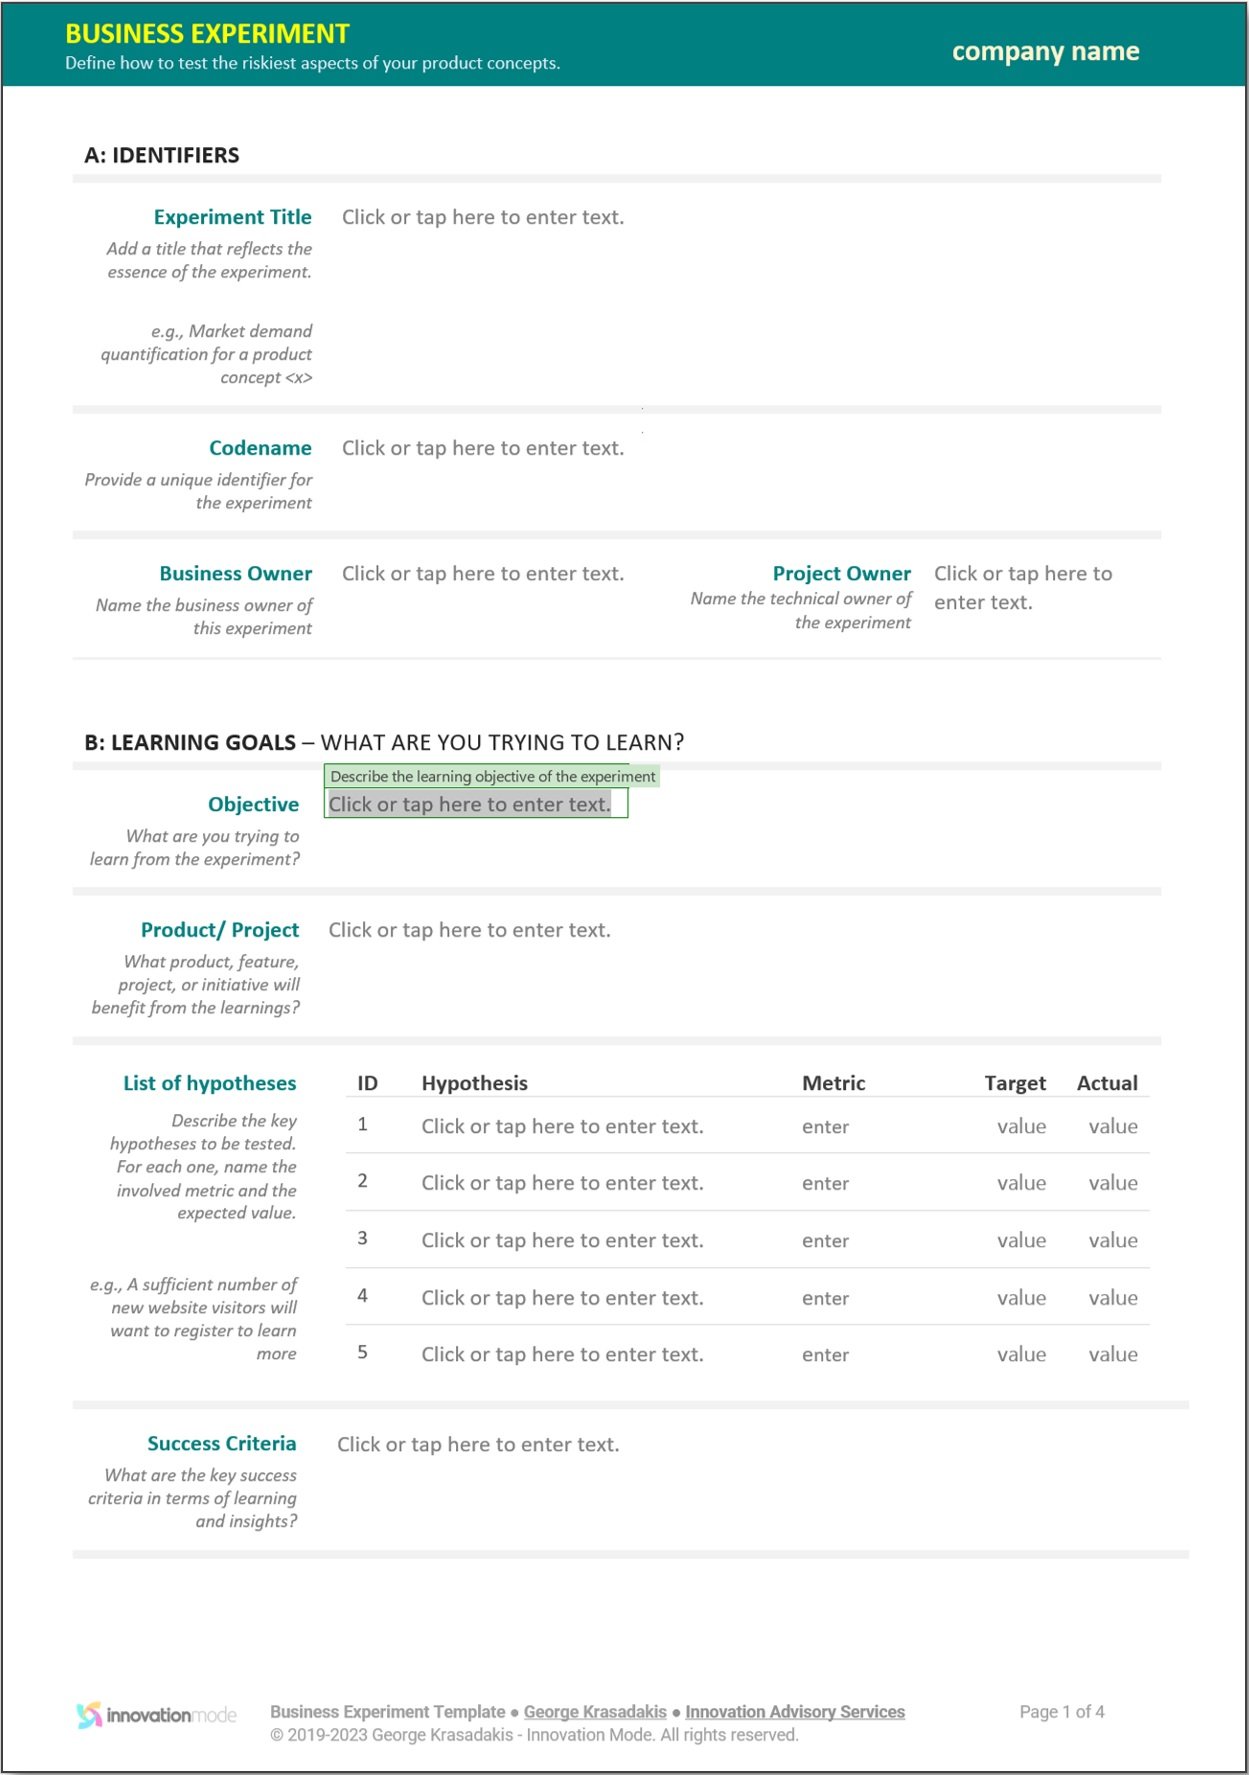
Experiment Identifiers
The signature of the experiment — a unique identifier, informative title, codename, description, and ownership. The experiment owner is accountable for the design, execution, and reporting of results. Establishes what and who owns it.
Learning Goals
What the team is trying to learn — stated as a narrative and a structured list of hypotheses. Each hypothesis includes a name, description, and threshold metrics representing the belief being tested. Also defines success criteria — when the experiment as a learning mechanism delivered on its purpose, regardless of whether hypotheses are validated or invalidated.
Form Factor
The type of experience served to the audience — what participants will interact with. Options include a landing page (measuring visitor engagement), a clickable prototype (testing usability), a functional prototype (capturing interaction data), a physical prototype (hands-on testing), or a proof of concept (demonstrating technical feasibility). Establishes the vehicle.
Audience
A carefully designed list of demographics, each with a communication channel and target sample size. The audience must be representative enough for results to be meaningful and actionable. Establishes the who participates and how they are acquired.
Planning
The experiment timeline — launch checklist, launch date, end date, and end conditions: a set of conditions over specific performance metrics that signal early termination. For example, when engagement falls below thresholds even after intervention. Establishes the when and the guardrails.
Decisions
Think a few steps ahead — what should happen on success or failure? A description of potential next steps for each primary outcome, along with key stakeholders. Pre-defining decisions brings alignment and clarity before results arrive — preventing political escalation when data is uncomfortable. Establishes the so what.
In-Product vs. Out-of-Product Experiments
As described in Innovation Mode 2.0, business experiments fall into two broad categories depending on whether they run inside an existing live product or independently. The distinction matters because each category has different recruitment, instrumentation, and decision-making implications.
In-Product Experiments
Delivered from within a live product to a subset of users. The system tracks engagement statistics to identify winning variants. Includes A/B testing (two or more versions of a feature), multivariate testing (evaluating multiple elements simultaneously), feature experiments (adding or removing features for specific user segments), and pricing experiments (testing different price points or models).
Out-of-Product Experiments
Conducted independently — either because the product doesn't exist yet or to avoid disrupting a live product. Includes functional prototypes (realistic implementations designed to test hypotheses), smoke testing (landing pages measuring interest before building), and service simulation methods like Wizard of Oz (simulating functionality manually) and Concierge Testing (transparent human-delivered service).
The Template in Action — Four Innovation Experiments
Each example demonstrates how the six-element framework converts silent assumptions into structured, testable hypotheses — producing the real-world evidence teams need to make informed decisions. These experiments typically follow a well-described business idea that has passed initial evaluation.
Validating Demand for an AI-Powered Expense Categorization Feature
Testing Willingness to Pay for a Real-Time Sustainability Dashboard
Measuring Engagement with AI-Personalized Learning Paths
Validating a Subscription Model for On-Demand Innovation Workshops
Hypothetical experiments written to illustrate how the six-element framework applies across industries — not based on any specific company or engagement.
Notice how each experiment defines success and failure criteria before running — not after. The hypothesis includes a specific threshold below which the team changes direction. As Innovation Mode 2.0 emphasizes: an experiment that provides strong real-world evidence to "kill" an opportunity is a successful one — it saves the organization from a costly misdirection. Once validated, ideas progress to a full product concept.
From Silent Assumption to Validated Learning
The Business Experiment Template is used after an idea has been described and evaluated, but before significant development resources are committed. A typical process:
Surface the silent assumptions. Review the "Big Unknowns" from the Business Idea. Identify beliefs that are adopted as given without being challenged. Convert them into testable hypotheses with specific thresholds.
Design the experiment. Fill in all six sections — identifiers, learning goals with hypotheses, form factor, audience, planning with end conditions, and pre-defined decisions for each outcome.
Run, measure, decide. Execute the experiment, collect real-world evidence against your predefined metrics, and make a clear go/no-go decision. Validated ideas progress to the Product Concept stage.
Organizations that adopt a culture of structured experimentation make better investment decisions, kill bad ideas earlier, and reach product-market fit faster. The Business Experiment Template makes experimentation repeatable — not ad hoc — ensuring every test produces learning, not just activity. As Innovation Mode 2.0 describes, the experimentation approach changes the perception of "failure" within the company: people are encouraged to test new ideas, and gradually accept failure simply as an outcome that didn't make it to the next stage — due to clear and objective justification.
About the Business Experiment Template
Common questions on innovation experimentation — drawn from practitioner experience and the methodology in Innovation Mode 2.0, Chapter 7.
What is a business experiment in innovation?
What are silent assumptions and why are they dangerous?
What are the six elements of the Business Experiment Template?
What types of business experiments can I run?
How is this different from Lean Startup or Strategyzer's Test Cards?
What makes a business experiment successful?
How does the Business Experiment Template fit into the innovation lifecycle?
The Validation Node Between Ideas and Products
The Business Experiment is the bridge from a promising idea to a development-ready product concept. It validates that an opportunity deserves to be built — before significant resources are committed.
Download the Business Experiment Template
The Business Experiment Template is included in the Innovation Toolkit 4.0 as both an editable MS Word document and a printable PDF — alongside seven other templates covering the full innovation lifecycle.
The methodology behind this template. Chapter 7 of Innovation Mode 2.0 covers the complete opportunity validation process — from distinguishing risks vs. uncertainties, to the Business Experiment Framing Template, to building prototypes and producing validation reports. The book provides the full framework: silent assumptions, experiment types, the validation team, and the six-step validation process. 340 pages. Springer, 2026. By George Krasadakis.