Data-Driven Companies and the Importance of a Data Culture
Data & technology alone do not ensure better decisions unless an additional component is added to the mix: the data-driven culture
Modern companies are typically overloaded with large volumes of heterogeneous data, from multiple sources. They make significant investments in technologies and architectures such as data marts, data warehouses, data lakes, and operational data stores with sophisticated Business Intelligence, Analytics, and Predictive systems on top. Nevertheless, data & technology alone do not ensure better decisions unless the right data-driven culture is there.
The term ‘Data-driven’ here implies much more than just technology and data. It means you need a special mindset and leadership attitude. This makes it possible for your company to make informed decisions by systematically using data to improve business performance.
The Data-Driven Culture
As the data engineering lead at Datamine decision support systems, I’ve seen several companies struggling to establish the so-called ‘data-driven culture.’ In many cases, even companies with sophisticated data technologies and mature data warehouses, failed to add the business users to the data analysis loop: the real risk of such data programs is the lack of general readiness to understand and leverage data and the lack of adoption of the corresponding tools.
To lead a data-driven culture, corporations need to first establish a stream of clean, accurate, reliable, and active data feeds reflecting all major business activities. All these qualities are critical for employees to trust the data, the technology, and the tools - any limitation can prove to be the single point of failure in making the data-driven vision happen.
Assuming the basics are there, employees need to start experiencing the benefits of being data-driven. It’s important for them to understand that, by using data, they can improve their decisions. Their jobs can be more efficient with a significant and measurable impact on the overall business.
Here are several ways to push employees in this direction:
Share information & knowledge on data models, tools, reports, and insights via ‘quick-start’ sessions.
Systematically share insights and interesting data findings.
Encourage people to interpret data and insights and even generate ideas/proposals on how to make them actionable.
Share real success stories on how the use of data allowed smart decisions with real gains for the company.
Share the vision and data strategy of the company. Ask for ideas, proposals, and requests.
Ask for feedback on the overall data-driven experience. Capture needs and requests for new reports, additional data points, or new data analysis capabilities, data models, and visualizations.
Run mini-hackathons with known, hidden patterns in your data (artificial or real ones) and asks teams to discover them (for hackathon templates check the innovation toolkit and also How to Run a Successful Corporate Hackathon)
Establish formal training sessions on data analysis and reporting tools.
Make data analysis a must for every business proposal, idea, and business case.
The Self-Service Insights Store
Every employee should be able to easily understand the performance of the company, the competitors, the local and global economic environment, and the dynamics of the market.
Employees need to build a habit of consuming well-defined (and designed) dashboards presenting business performance, trends, social signals, and other insights, along with the outcomes of particular business decisions.
As employees become data-aware and the complexity of data increases, a new class of systems is needed: a self-service insights platform to empower business users to perform their own information exploitation, analysis, and visualization; to submit questions, consume dashboards and predefined reports; to dynamically generate reports via simple user interfaces; to easily define their what-if scenarios and get instant answers.
While the typical data warehouses and data lakes target particular classes of users (like data analysts and data scientists) the self-service insights store is open to any authorized employee - no special skills required.
It’s an easy-to-use data analysis surface (powered by a range of data technologies, analytical, and reporting engines) where insights and analytics are exposed in a modular form as active, reusable widgets and related reporting elements.
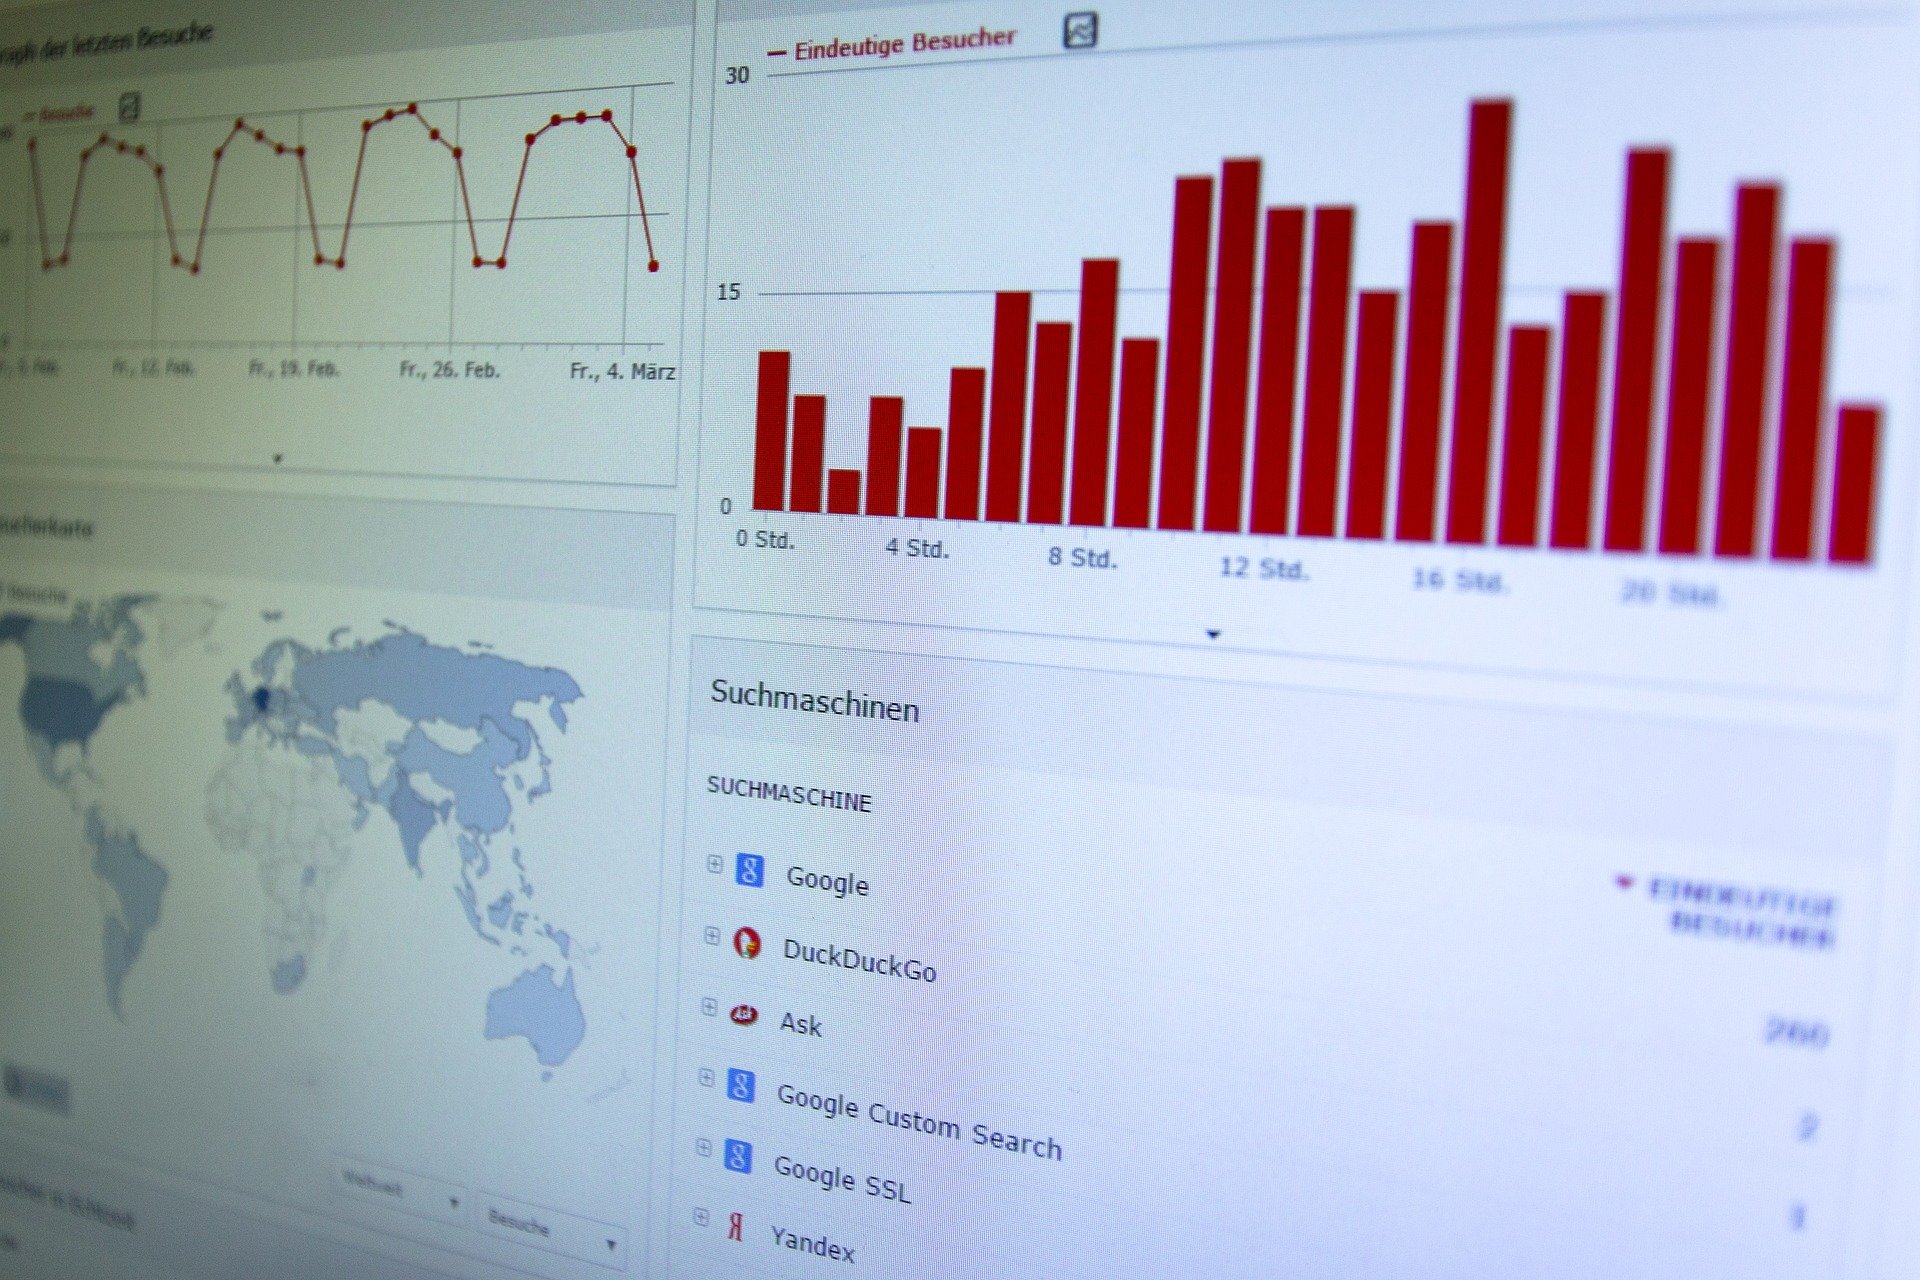
This self-service insights store could take the form of a configurable and adaptive dashboard system that is based on an expandable range of predefined, active insight widgets.
This could eventually become a repository of insights where new widgets get deployed and become usable by employees through custom dashboards and integration scenarios: Employees can easily reuse these insight widgets and combine them in customized, named dashboards that better serve their business needs.
Interactive Data Stories
Interactive data stories provide a modern way to package and communicate data findings and interesting patterns, within the corporation. Either manually or automatically generated by AI, data stories can present a particular aspect of the business, the impact of certain decisions, and the results of large-scale online experiments.
The focus is on the user experience so that the story is delivered in a smooth, interactive way with multiple dimensions and entry points, taking into consideration the perspective of particular users according to their role, seniority, and department within the organization.
Smart Insights Through Smart Buildings
Smart buildings could be directly connected to the self-service insights store in order to access white-listed widgets (suitable for exposure within the building) and visualize business insights through the network of public screens within the corporate buildings. This experience could be contextual (to space, seasonality, team) delivering relevant insights to the right users at the right time. For instance, public screens in the sales team area present sales performance metrics while in IT they experience network utilization KPIs.


